2-2. Introduction of AC Impedance basics (II)
AC impedance spectroscopy, also known as electrochemical impedance spectroscopy (EIS), is an electrochemical method (steady-state method) that applies an AC potential to an electrochemical system over a range of frequencies. By measuring the current, the impedance at each frequency is calculated. Impedance is further analyzed and illustrated by an equivalent circuit of basic circuit elements, and the electrochemical reactions occurring at the electrode/electrolyte interface are described.
2-2-1. DC potential (fixed voltage) vs AC potential (sinusoidal signal)
When a DC potential with a fixed voltage is applied to an electrochemical system, such as the amperometry (Amperometry, IT) introduced in Section 1-2-2-4, it can be seen that the current has a transient time and then enter a steady state, and become a horizontal line with a fixed value.
.webp) Fig. 2-2-1 (a). Fixed voltage DC potential and DC current signal.
Fig. 2-2-1 (a). Fixed voltage DC potential and DC current signal.Qualitative and quantitative analysis is carried out using DC potential methods by measuring the current response to the application of the proper voltage. This method usually provides information about a specific electrochemical reaction occurring in a system. However, this method does not provide complete physical and chemical behaviors of the system during the electrochemical reaction. When an AC potential is applied, the electrochemical system is maintained at the above-mentioned transition time. The phenomenon such as charging and discharging of storage structure and diffusion of ions occurring in the system is detected dynamically.
Usually, single sinusoidal wave is used as the AC potential in AC impedance methods. The waveform can be presented as:
e(t) = E sin (ωt) .webp) Fig. 2-2-1 (b). Single sinusoidal wave AC potential.
Fig. 2-2-1 (b). Single sinusoidal wave AC potential. E is the voltage amplitude, ω is the angular frequency, and t is the time. Angular frequency is measured in radians per second, and it is 2π times the ordinary frequency (f, measured in Hz).
The measured AC current can also be presented as:
i(t) = I sin (ωt + Ψ).webp) Fig. 2-2-1 (c). AC potential an AC current signal.
Fig. 2-2-1 (c). AC potential an AC current signal..webp)
Fig. 2-2-1 (d). Phase angle.
I is the current amplitude, Ψ is the phase angle (φ) corresponding to the phase shift of voltage and current waveform. The concept of phase shift is that the AC current of the system does not always synchronize with the applied AC potential. There may be charging and discharging structures similar to capacitances, or counter current phenomenon similar to inductances in the system. These cause the current signal to appear prior or later to the applied potential, known as leading or lagging currents. Fig .2-2-1 (c) is an illustration of leading current.
2-2-2. Impedance
By knowing the applied AC potential, and obtained the AC current signal, the Impedance (Z) of the electrochemical system is calculated by Omh’s Law:
E = I R
Z = e(t) / i(t)
The impedance includes the amplitude (|Z|) and the applied phase shift (∠Ψ). It is usually presented in vector form on the complex plane, which is composed of the real parts Zre)and imaginary parts(imaginary parts, Zim)For easier using the complex plane, the following transformation and derivation will apply Euler’s formula:
Euler’s formula: ejωt = cos(ωt) + j sin(ωt) (e is the Euler’s number)
Transform e(t) = E sin(ωt) to e(t) = E cos(ωt-π/2) + j E sin(ωt-π/2) = E ej(ωt-π/2)
Also, transform i(t) = I sin (ωt + Ψ) to i(t) = I ej(ωt-π/2+Ψ)
Z = e(t) / i(t) = (E ej(ωt-π/2)) / (I ej(ωt-π/2+Ψ)) = E/I ej(-Ψ) = |Z| ej(-Ψ)
Z = |Z| cos(-Ψ) + j |Z| sin(-Ψ) = |Z| cos(Ψ) – j |Z| sin(Ψ)
Z = Zre – j Zim
.webp) Fig. 2-2-2 (a). AC impedance on the complex plane.
Fig. 2-2-2 (a). AC impedance on the complex plane.Since the AC impedance of the system varies with the applied frequency, the EIS method measures the current response to an applied AC voltage as a function of frequency and the corresponding AC impedance is shown in Fig. 2-2-2 (b):
.webp) Fig. 2-2-2 (b). 3D plot of AC impedance, with real parts, imaginary parts and angular frequency
Fig. 2-2-2 (b). 3D plot of AC impedance, with real parts, imaginary parts and angular frequencyAfter the relationship between AC impedance and frequency is obtained, the electrochemical system is further understood through various analysis methods described in the following chapters.
2-2-3. Equivalent circuit model and circuit elements
The physical phenomenon and chemical reactions at the electrode interface of an electrochemical system are diverse and complex. Therefore, the equivalent circuit model is often used to understand a system. By using simple circuit elements with similar characteristics, the physical and chemical properties of an electrochemical system are described.
Three types of circuit elements are commonly used in equivalent circuits, including resistors, capacitors, and inductors.
2-2-3-1. Resistance
Resistance is the resist to current/electron flow in a circuit and its value is expressed as R in ohms (Ω). In the equivalent circuit, E = I R is used in accordance with Ohm's law, i.e., the impedance of the resistor is ZR = R. This impedance has no correlation with frequency and does not cause a phase shift between potential and current, i.e., the phase shift is 0°, which is a pure real part impedance.
In an electrochemical system, resistors are chosen to represent different resistances in equivalent circuits when currents pass through different substances or interface.
.webp) Fig. 2-2-3-1 (a). Potential and current of resistor.
Fig. 2-2-3-1 (a). Potential and current of resistor..webp)
Fig. 2-2-3-1 (b). No phase shift.
2-2-3-2. Capacitance
Capacitance is the ability of a circuit or device to store the electrical charge at a certain voltage. The capacitance value is expressed as C and the unit is Farad (F). Capacitance is designated as two parallel electrode plates in a general circuit, and the relationship between capacitance, charge and potential is expressed as:
q = C v
The relationship between current and charge is given by the following equation:
i = dq/dt
i = C dv/dt
Using a single sinusoidal potential, the impedance of a capacitor is calculated as ZC = 1 / jωC. Impedance decreases as frequency increases. It is a pure imaginary part impedance that causes a leading current of 90° phase shift. During a simple circuit analyzation, capacitors are viewed as components that short at high frequency and open at low frequency.
In an electrochemical system, capacitors are chosen to represent charge storage capability in equivalent circuits when cascading occurs between interfaces.
.webp) Fig. 2-2-3-2 (a). Potential and current of capacitor.
Fig. 2-2-3-2 (a). Potential and current of capacitor..webp)
Fig. 2-2-3-2 (b). Current leading 90°
2-2-3-3. Inductance
Inductance is the ability to resist a change in current due to the magnetic flux (φ) and induced electromotive force generated when the current flowing through a circuit. The inductance value is expressed as L and the unit is Henry (H). Inductors are very common in electrical circuits and the schematic symbol for an inductor is a coil of wire. The relationship between inductance, current, magnetic flux and the number of coils turns (N) can be expressed as:
N φ = L i
The relationship between induced electromotive force and magnetic flux is given by the following equation:
v = N dφ/dt
v = L di/dt
Using a single sinusoidal potential, the impedance of an inductor ZL = jωL. Impedance increases as frequency increases. It is a pure imaginary part impedance that causes a lagging current of 90°phase shift. During a simple circuit analyzation, inductors can be viewed as components that open at high frequency and short at low frequency.
In an electrochemical system, when there is an electromotive force induced by magnetic flux and current flowing through it, inductors are used to represent the ability to resist a change in current in equivalent circuits.
.webp) Fig. 2-2-3-3 (a). Potential and current of inductor
Fig. 2-2-3-3 (a). Potential and current of inductors
.jpg)
Fig. 2-2-3-3 (b). Current lagging 90°
A quick comparation of resistor, capacitor and inductor is as the following table:
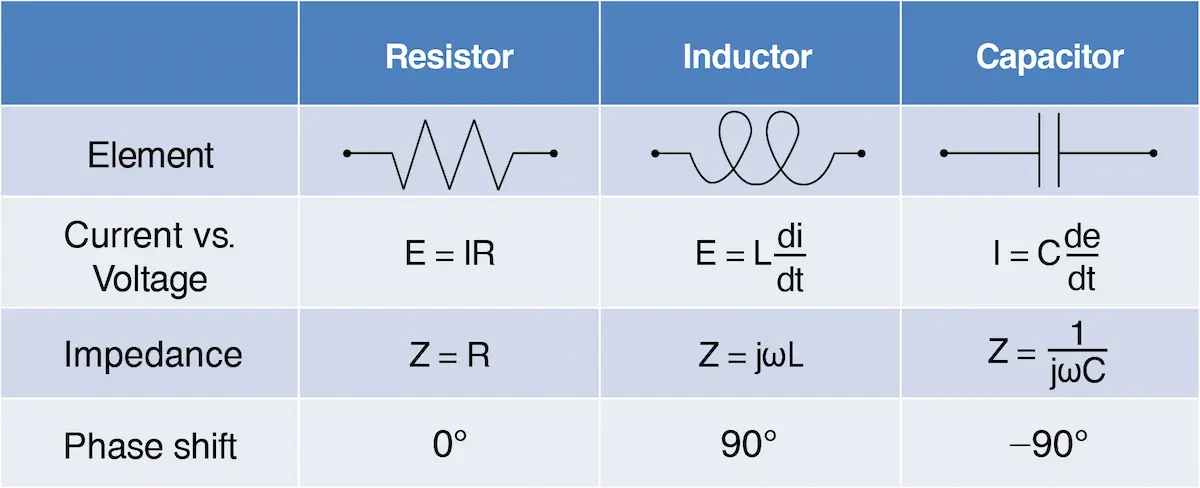 Table 2-2-3. comparation of resistor, capacitor and inductor.
2-2-4. Nyquist plot and Bode plot
As introduced in Chapter 2-2-2, the results obtained from the AC impedance or EIS analysis is generally expressed in three-dimensional graph or diagram, which consists of three axes: angular frequency (ω), real parts (Z’) and imaginary parts (Z’’). The frequency axis is usually represented in logarithmic scale, as shown in Fig.
.webp) Fig. 2-2-4(a). 3D plot of AC impedance, with real parts, imaginary parts and angular frequency. Side A is the Nyquist plot, Side B and C are not Bode plots, but can be used according to analyzation needs. Bode plots are |Z| to frequency (D) and Ψ to frequency (E).
Fig. 2-2-4(a). 3D plot of AC impedance, with real parts, imaginary parts and angular frequency. Side A is the Nyquist plot, Side B and C are not Bode plots, but can be used according to analyzation needs. Bode plots are |Z| to frequency (D) and Ψ to frequency (E)..webp) Fig. 2-2-4(b). Example for each plot (A~E) in Fig. 2-2-4(a), by measuring an RC parallel circuit.
Fig. 2-2-4(b). Example for each plot (A~E) in Fig. 2-2-4(a), by measuring an RC parallel circuit.Nyquist plot and Bode plot are the most common 2D graphs that represent AC impedance. A Nyquist plot has the real parts on the x-axis and imaginary parts on the y-axis, with frequency information hidden as side A in Figure 2-2-4. A Bode plot consists of frequency or angular frequency on the x-axis and total impedance (|Z|) and phase angle (φ) on the y-axis, shown as side D and E in Fig. 2-2-4. Following are some examples showing the Nyquist plot and Bode plot of simple circuits containing resistors and capacitors.
2-2-4-1. Pure resistor
Circuit of pure resistor has only the real parts impedance. The impedance value does not vary with frequency, and causes no phase shift. Therefore, there is only one point on the x axis of Nyquist plot, and the value is the resistance (R) of the resistor. On Bode plot, there is a horizontal line of value R for total impedance amplitude, and a horizontal line of value 0° for phase shift.
.webp) Fig. 2-2-4-1 (a). Theoretical Nyquist plot and Bode plot for circuit of pure R.
Fig. 2-2-4-1 (a). Theoretical Nyquist plot and Bode plot for circuit of pure R.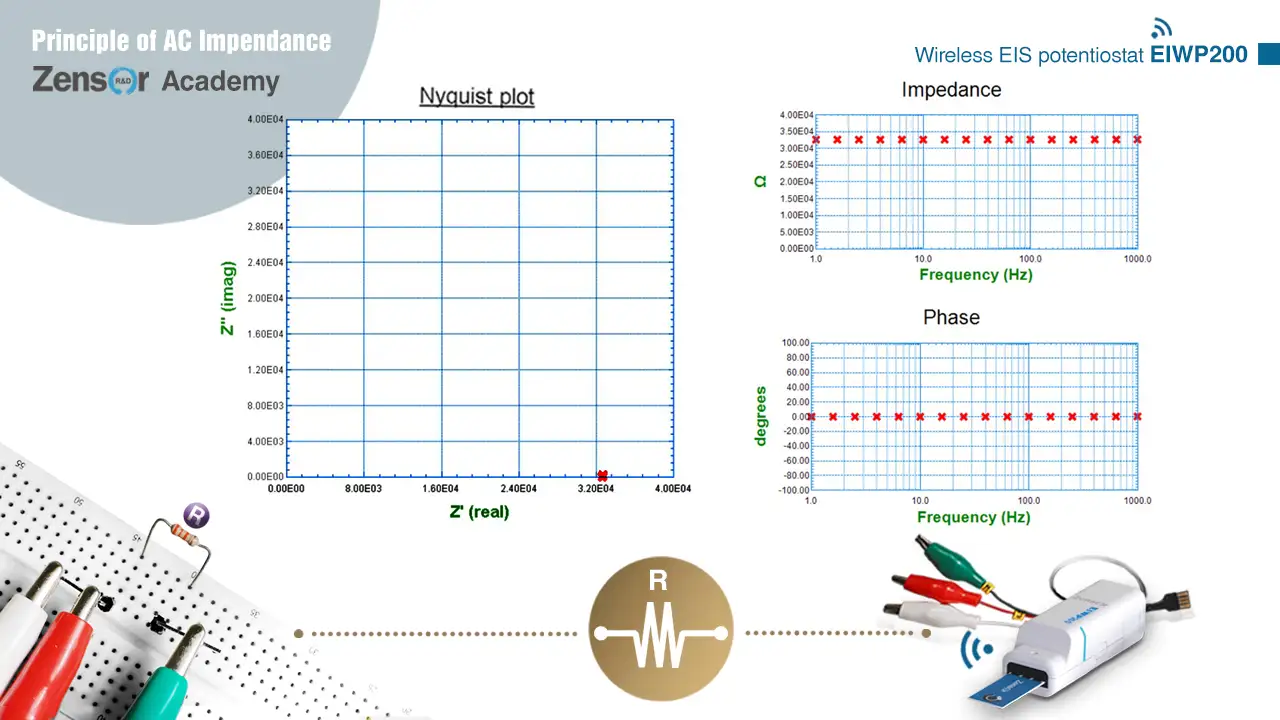 Fig. 2-2-4-1 (b). Experimental Nyquist plot and Bode plot for circuit of pure R.
2-2-4-2. Pure capacitor
Circuit of pure capacitor has only the imaginary parts impedance. The impedance value approaches 0 as the frequency gets high, and causes a phase shift of -90°. Therefore, it shows a vertical line overlapping the y axis of Nyquist plot. On Bode plot, it shows a curve of high impedance at low frequency and impedance = 0 at high frequency, and a horizontal line of value 90° for phase shift.
Fig. 2-2-4-2 (a). Theoretical Nyquist plot and Bode plot for circuit of pure C.
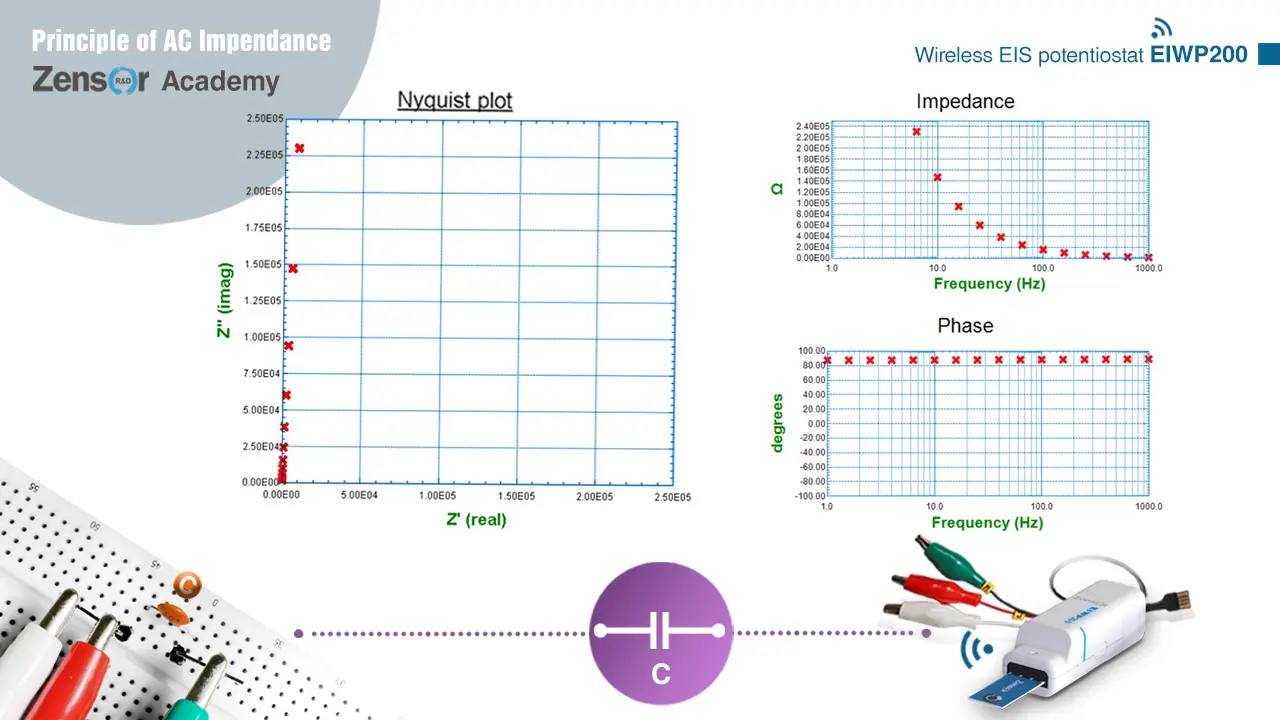
Fig. 2-2-4-2 (b). Experimental Nyquist plot and Bode plot for circuit of pure C.
2-2-4-3. RC serial
In a serial circuit, total impedance equals to the sum of serial elements. For RC serial circuit, impedance equals to R + 1 / jωC. It shows a vertical line of x = R in Nyquist plot. On Bode plot, it shows a curve of high impedance at low frequency and impedance = R at high frequency, and a curve of phase shift = 90° at low frequency and phase shift = 0° at high frequency.
Fig. 2-2-4-3 (a). Theoretical Nyquist plot and Bode plot for RC serial circuit.
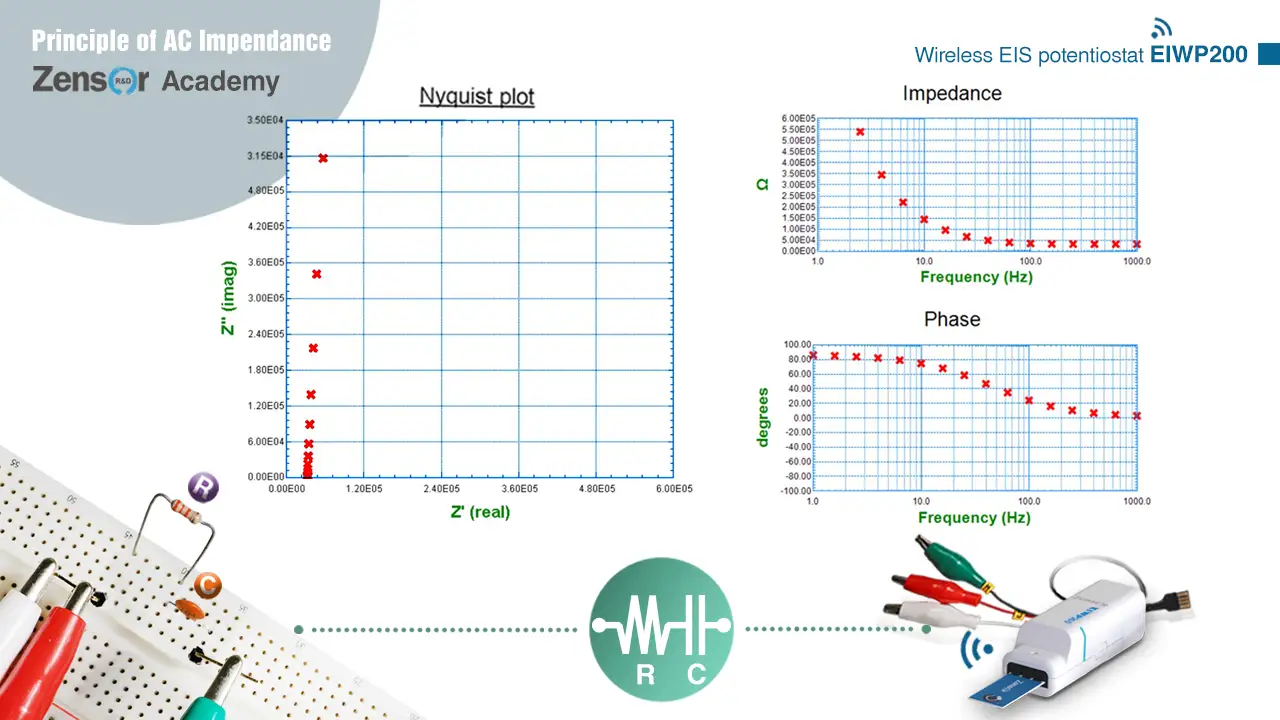
Fig. 2-2-4-3 (b). Experimental Nyquist plot and Bode plot for RC serial circuit.
2-2-4-4. RC parallel
In a parallel circuit, reciprocal of total impedance equals to the sum of reciprocal of parallel elements. The derivation of RC parallel is as following:
1/Z = 1/R + 1/(1/jωC) = (jωRC + 1) / R
Z = R / (jωRC + 1) = (R – jωR2C) / (ω2R2C2 + 1)
It shows a semicircle in Nyquist plot approaching (0, 0) at high frequency and approaching (R, 0) at low frequency. On Bode plot, it shows a curve of impedance = R at low frequency and impedance = 0 at high frequency, and a curve of phase shift = 0° at low frequency and phase shift = 90° at high frequency.
Fig. 2-2-4-4 (a). Theoretical Nyquist plot and Bode plot for RC parallel circuit.
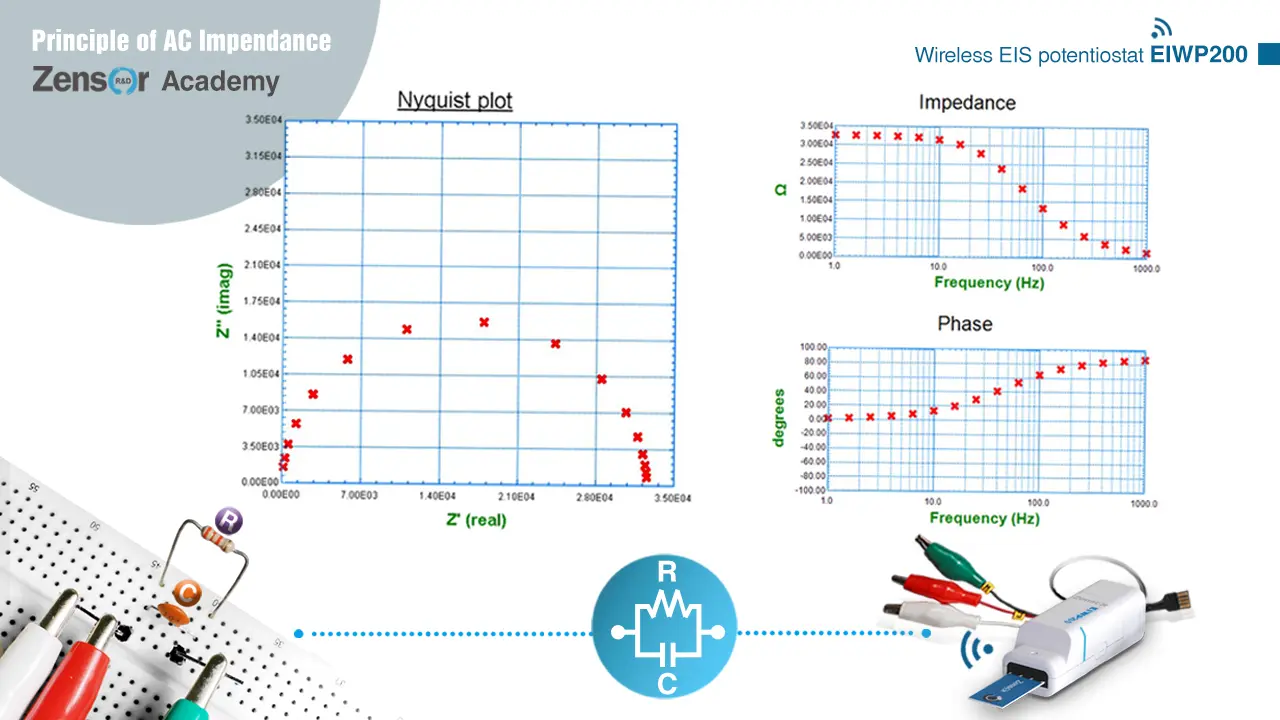
Fig. 2-2-4-4 (b). Experimental Nyquist plot and Bode plot for RC parallel circuit.
2-2-5. Randles equivalent circuit an example for modeling electrochemical system
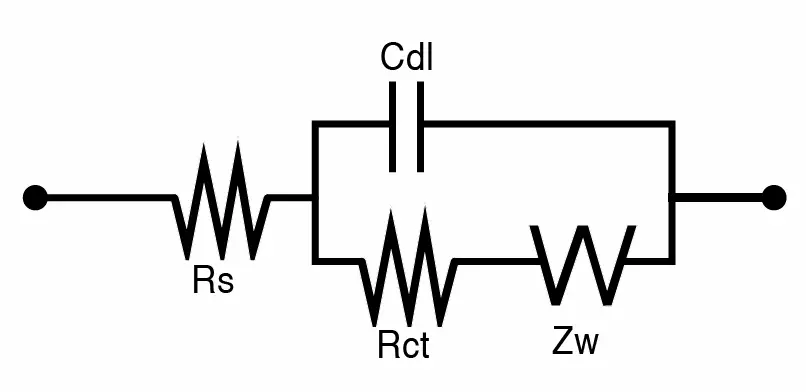
Randles equivalent circuit is a commonly used equivalent circuit model for electrochemical systems. The circuit is shown as Fig. 2-2-5 (a):
.webp) 圖 2-2-5 (c). Randles equivalent circuit高頻簡化之等效電路與奈奎斯特圖
圖 2-2-5 (c). Randles equivalent circuit高頻簡化之等效電路與奈奎斯特圖Fig. 2-2-5 (a). Randles equivalent circuit modeling an electrochemical system.
Rs is the resistance of the electrolyte. Cdl is the capacitance characteristic of an electric double layer. Rct is the resistance of charge transfer. Cdl and Rct are the main items corresponding to the electrochemical reactions happening on the electrode-electrolyte interface.
Warburg impedance (Zw) is the impedance of ion diffusion that varies with frequency. When the frequency is high, ions in the system cannot immediately change their direction and move with the alternating potential. Therefore, Zw is not significant at high frequency. On the other hand, ions have enough time to be attracted or distracted by the potential of electrodes at low frequency. Thus, charge transfer and phenomenon of charging and discharging exist. Zw can be viewed as series of multiple paralleled RC in equivalent circuit, as shown in Fig. 2- 2-5 (b):
.webp) Fig. 2-2-5 (b). equivalent circuit of Warburg impedance.
Fig. 2-2-5 (b). equivalent circuit of Warburg impedance.左圖.webp) 圖 2-2-5 (c). Randles equivalent circuit高頻簡化之等效電路與奈奎斯特圖
圖 2-2-5 (c). Randles equivalent circuit高頻簡化之等效電路與奈奎斯特圖Having characteristic of both resistors and capacitors, Zw is composed of both real parts and imaginary parts. It is expressed as:
Zw = Aw/√ω + Aw/j√ω
Aw is the Warburg coefficient, and it is related to ion diffusion condition of the system, including ion concentration, diffusion coefficient, and temperature, etc. Suggested from the formula of Zw, it is a constant phase element having a -45° phase angle. When a straight line of 45° is observed in Nyquist plot, it represents the effect of Zw.
When the frequency is high, Zw is not significant. The equivalent circuit is dominated by serial of Rs and parallel of Cdl and Rct. Further, it can be viewed as only Rs at extremely high frequency. Therefore, the simplified Nyquist plot for high frequency is a semicircle with impedance approaching Rs at high frequency and impedance approaching Rs + Rct at low frequency, as shown in Fig. 2-2-5 (c):
圖 2-2-5 (c). Randles equivalent circuit高頻簡化之等效電路與奈奎斯特圖 When the frequency is low, Cdl can be view as open circuit. The equivalent circuit is dominated by serial of Rs, Rct and Zw. Due to the constant phase characteristic of Zw, a straight line of 45∘ is shown in Nyquist plot as Fig. 2-2-5 (d).
Fig. 2-2-5 (d). Simplified circuit diagram and Nyquist plot for Randles equivalent circuit at low frequency.Combining both of the simplified graphs, the Nyquist plot of Randles equivalent circuit is shown as Fig. 2-2-5 (e):
圖 2-2-5 (e). Circuit diagram and Nyquist plot for Randles equivalent circuit.2-2-6. Example for modeling electrochemical system
Randles equivalent circuit is frequently used in electrochemical experiments, but the systems are usually a lot more complex. In order to build up effective circuit model to fit measuring results, understanding of the electrochemical system to a certain level is required.
In this chapter, a thin film (Nafion) modified electrode from reference [1] is taken as an example for a more complex system. The system and equivalent circuit is shown as following:
右圖-11.webp)
Fig. 2-2-6 (a). Thin film modified electrode and corresponding equivalent circuit model. [1]
Rs is the resistance of solution. Rct and CPE are the impedance of thin film and electrode interface. CPE is ideally being Cdl, and is related to the roughness of electrode surface. ZD is the diffusion impedance in the thin film, which is similar to a Warburg element. These 4 elements can be comprehended from Randles equivalent circuit in chapter 2-2-5.
Additionally, Cb (bulk capacitance) and Rb (bulk resistance) are representing the dielectric character of the thin film, while Cfs and Rfs are the impedance caused by ions enter and exit the thin film to maintain electrical neutrality.
The Nyquist plot of the equivalent circuit is as below:
右圖-11.webp) Fig. 2-2-6 (a). Nyquist plot of thin film modified electrode. [1]
Fig. 2-2-6 (a). Nyquist plot of thin film modified electrode. [1]It can be observed that the first semicircle at high frequency is dominated by the dielectric characteristic (Cb and Rb). The second semicircle is dominated by the film-electrode interface (CPE and Rct). Following with the diffusion impedance ZD showing a 45∘Warburg feature. At last, a vertical line shows at the low frequency end representing the capacitance characteristic of the thin film.
參考文獻[1] Jyh-Myng Zen,* Govindasamy Ilangovan, and Jia-Jen Jou, Anal. Chem. 1999, 71, 2797-2805
Next Article →Think it's a good article?
Share it with others


.webp)
.webp)
.webp)

.webp)
左圖.webp)
右圖.webp)
右圖-11.webp)


.png)